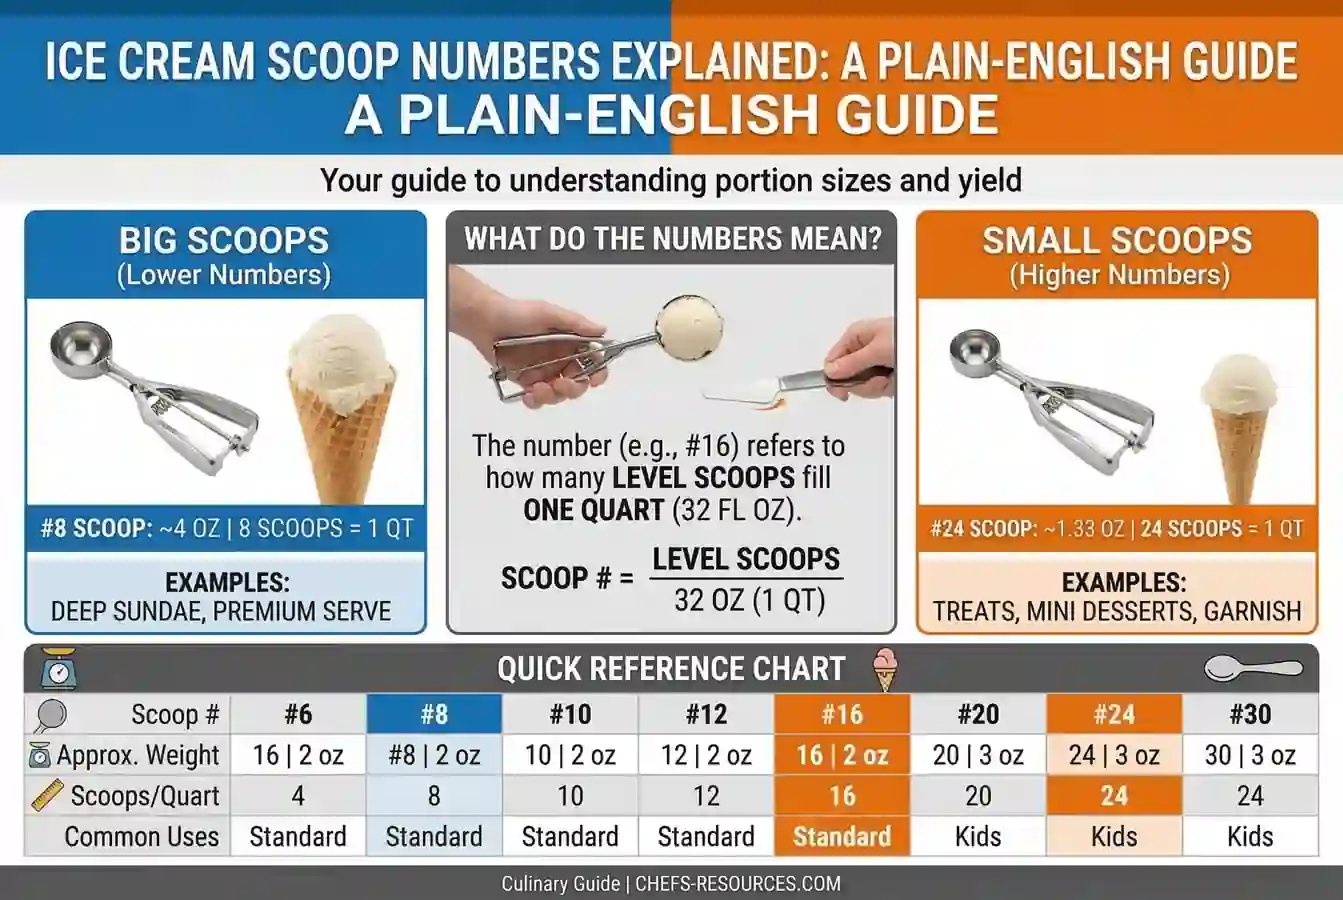
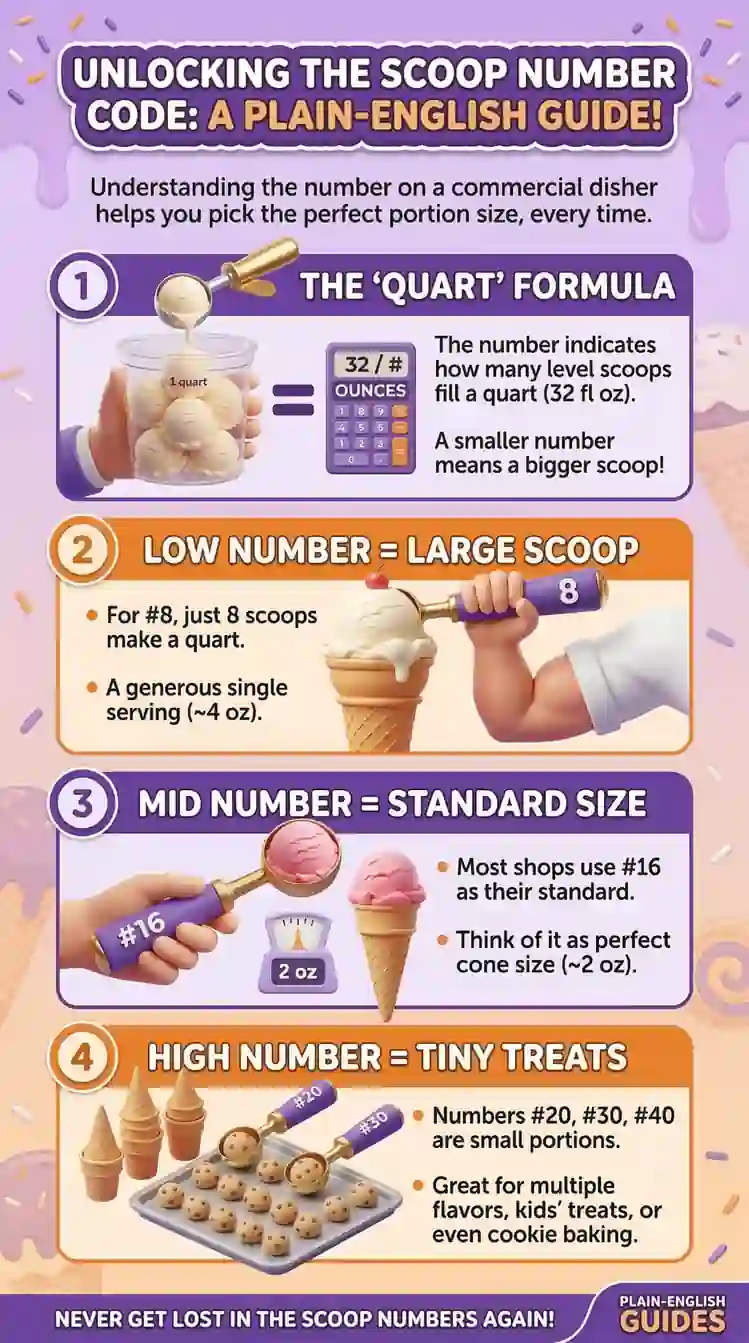
The number on your scoop is a portioning formula. Divide 32 by that number and you have your fluid ounce yield. A #16 gives you 2 ounces. A #10 gives you 3.2 ounces. Higher number, smaller scoop — always. That is the entire system, and it takes about 30 seconds to understand.
What takes longer — and what most operators never fully close the gap on — is what happens after the formula clicks. We have worked with commercial kitchens where the operator understood the numbering system perfectly and still had no standardized disher assignment, no color-coded station reference, and no audit cadence. The formula was not the problem. The application was. And in a kitchen running 200 scoops a day at 3–5% pre-tax margin, the application is where the money lives.
Here is what this page gives you that a standard scoop size chart does not:
A plain-English breakdown of the numbering system from #4 through #100 — what each number means, what it delivers in ounces and tablespoons, and why the inverse relationship between number and size trips up even experienced operators
The handle color system mapped to the numbers — so your team can grab the right tool during a rush without reading anything
The cost math behind each size — built from our own kitchen testing, not manufacturer estimates
A practical portioning framework that takes the formula off the page and turns it into a system that holds up across a full service, a full season, and a food cost audit
We built this reference because the formula alone does not protect your margin. The system does.
TL;DR Quick Answers
Ice Cream Scoop Size
Ice cream scoop size is based on a numbering system where the number tells you how many level scoops fill a 32-ounce container. Divide 32 by the scoop number to get the fluid ounce yield per portion.
#8 scoop = 4 oz — generous single or premium presentation
#10 scoop = 3.2 oz — artisan and specialty shop standard
#12 scoop = 2.67 oz — premium single scoop
#16 scoop = 2 oz — commercial default for most ice cream shops
#20 scoop = 1.6 oz — high-volume or two-scoop operations
#24 scoop = 1.33 oz — smaller specialty portions
The commercial standard is a #16 disher at 2 fluid ounces. A higher scoop number always means a smaller portion. Handle colors are standardized across most manufacturers for quick station identification — a #16 carries a blue handle, a #12 carries green, a #8 carries gray.
The right scoop size depends on three things: your concept, your price point, and the cost math behind your product. Most food cost problems traced back to scoop size aren't a formula problem. They're a missing system problem — no assigned disher per menu item, no chart at the station, no monthly audit. The formula takes thirty seconds to learn. The system is what protects the margin.
Top Takeaways
The number on the scoop is a portioning formula. Divide 32 by the scoop number. That's your fluid ounce yield. Higher number, smaller scoop. Thirty seconds to learn. A lifetime of margin protection if you apply it.
Knowing the formula and building a system around it are two different things. Most food cost problems we diagnose aren't a formula problem. They're a missing system problem. No assigned disher. No color chart. No monthly audit. The formula is thirty seconds. The system is what holds the margin.
A half-ounce of drift is the difference between 1.1% and 4.3% pre-tax income. Most independent ice cream shops run below $2M in annual sales. At that volume, the NRA puts median pre-tax income at 1.1%. Portioning consistency isn't a best practice at those margins. It's a survival requirement.
One scoop size decision touches four things at once: food cost, waste, customer perception, and staff consistency. Overportioning erodes margin while looking like generosity. Underportioning damages perception while looking like cost control. The right number — held consistently — moves all four in the right direction.
The complete system is four steps:
Assign one disher number per menu item
Post a laminated color and ounce chart inside the reach-in door
Weigh ten scoops on the first of every month
Adjust before drift compounds
Payback starts in the first week of service.
The Formula Behind Every Scoop Number
The scoop numbering system is built on one rule: the number stamped on your disher tells you how many level scoops it takes to fill a 32-ounce quart container. Divide 32 by that number and you have your fluid ounce yield per portion.
32 ÷ scoop number = fluid ounces per portion
That is it. Everything else in the numbering system is a consequence of that formula. A #8 scoop fills a quart in 8 scoops — 4 ounces each. A #24 fills it in 24 scoops — 1.33 ounces each. The number is not a size label. It is a portioning formula. Once that distinction is clear, the entire system becomes predictable.
The place this trips operators up consistently: the relationship between number and size is inverse. A higher number always means a smaller portion. A #10 is larger than a #20. A #30 is smaller than a #12. We have watched experienced kitchen operators reach for a #24 when they needed a generous portion — because in almost every other numbering context, a higher number means more. Not here. Higher number, smaller scoop. Always.
The Complete Scoop Number Reference: #4 Through #100
Every standard commercial disher size, with fluid ounce yield and tablespoon equivalent:
#4 = 8.0 oz / 16.0 Tbsp — large entrée and bulk portioning
#5 = 6.4 oz / 12.8 Tbsp — large single servings
#6 = 5.33 oz / 10.7 Tbsp — generous single scoop, oversized presentations
#8 = 4.0 oz / 8.0 Tbsp — premium single scoop, large sundae base
#10 = 3.2 oz / 6.4 Tbsp — standard single scoop, artisan and premium shops
#12 = 2.67 oz / 5.33 Tbsp — cost-conscious single scoop, two-scoop presentations
#16 = 2.0 oz / 4.0 Tbsp — commercial default, high-volume service
#20 = 1.6 oz / 3.2 Tbsp — two-scoop volume service, tighter margin models
#24 = 1.33 oz / 2.67 Tbsp — smaller dessert portions, add-on scoops
#30 = 1.07 oz / 2.13 Tbsp — tasting portions, mix-in scoops
#40 = 0.80 oz / 1.6 Tbsp — small garnish portions, cookie dough prep
#50 = 0.64 oz / 1.28 Tbsp — truffles, small confection portioning
#60 = 0.53 oz / 1.07 Tbsp — melon balls, small garnish applications
#100 = 0.32 oz / 0.64 Tbsp — butter portions, micro-garnish, plating work
One important note from our kitchen testing: these yields are for level scoops. A heaped scoop on a #16 can run 2.4–2.6 ounces — 20–30% above the standard yield. That variance does not show up on a chart. It shows up on the P&L three months into a season when nobody can explain why food cost is running two points high.
What the Handle Colors Tell You — And Why They Matter More Than the Numbers
Every standard commercial disher is assigned a handle color that corresponds to its number. The color system exists for one reason: during a service rush, nobody reads numbers. They grab a tool. The color is what prevents the wrong tool from landing in the wrong product at the wrong moment.
Standard handle color assignments:
Orange = #4 (8 oz)
White = #6 (5.33 oz)
Gray = #8 (4 oz)
Ivory = #10 (3.2 oz)
Green = #12 (2.67 oz)
Blue = #16 (2 oz)
Yellow = #20 (1.6 oz)
Red = #24 (1.33 oz)
Black = #30 (1.07 oz)
Orchid = #40 (0.80 oz)
Note from our experience: handle colors are standardized across most manufacturers but not all. Before building a color-coded station system, verify your specific disher set against this chart. One off-brand disher with a non-standard color in a color-coded system creates exactly the kind of quiet portioning error that compounds across a full service before anyone catches it.
Post this color reference inside your reach-in door. Not in the training manual. Not in the office. At the station, where staff see it every time they reach for a product.
Why Volume and Weight Are Not the Same Number — And Why It Matters for Costing
The scoop number system measures volume — not weight. A #16 disher holds 2 fluid ounces of product regardless of what you are scooping. The weight of that 2 fluid ounces varies significantly depending on product density and overrun.
From our kitchen testing on a #16 disher:
Premium high-fat ice cream: approximately 2.4 oz by weight
Standard commercial ice cream: approximately 2.0–2.2 oz by weight
High-overrun economy product: approximately 1.8 oz by weight
This distinction matters the moment you try to build a cost model using weight-based purchasing data against volume-based yield data. Most operators buy ice cream by the gallon or tub — a volume measure. Most manufacturers report mix ratios and overrun as percentages of weight. If you are costing portions using the chart formula alone without verifying against your specific product, your portion cost is an estimate — not a calculation.
The fix: weigh ten consecutive level scoops of your specific product. Divide by ten. That is your actual working weight per portion for cost modeling purposes. Run it against your tub cost. That is the number your menu price needs to be built around.
How Scoop Numbers Connect Directly to Food Cost
This is the section of the numbering explanation most reference charts skip, and it is the one that matters most in a commercial operation. The scoop number is not just a portioning tool. In effective kitchen management, every number decision is a food cost decision.
From our kitchen testing using a standard 3-gallon tub at $45 (384 fluid ounces / $0.117 per oz):
#8 (4 oz): $0.47 per portion
#10 (3.2 oz): $0.37 per portion
#12 (2.67 oz): $0.31 per portion
#16 (2 oz): $0.23 per portion
#20 (1.6 oz): $0.19 per portion
Moving from a #16 to a #8 more than doubles your portion cost. At 200 scoops per day, that difference is not a preference — it is a compounding daily margin decision that runs through every transaction in the building.
The operators we have watched manage this most effectively do not think of the scoop number as a serving size choice. They think of it as a cost model input — chosen after the menu price is set, the food cost target is established, and the vessel format is confirmed. The number comes last. The business case comes first.
Where the Scoop Numbering System Gets Misapplied in Real Operations
After years of working with commercial kitchens, these are the misapplication patterns we see most consistently:
Using dishers for frozen service. Dishers are built for soft products — dough, batters, mashed potatoes. The sweep blade mechanism degrades under hard-pack ice cream. Worn mechanism equals inconsistent release equals portion drift. Use true ice cream scoops at the service station.
Running multiple numbers without a station system. Two staff members, two different interpretations of which scoop goes with which product. No color chart. No standardized assignment. Portions vary by who is on the station. The fix is a laminated color reference inside the reach-in door and one assigned disher number per menu item — no judgment calls during service.
Heaping instead of leveling. A heaped #16 is not a #16. It is a #12 or smaller at a #16 price point. Train level scoops from day one. Reinforce at the start of every season.
Assuming the number on the scoop matches the actual yield. Manufacturer tolerances vary. Vollrath dishers are among the most consistent against the standard chart. Other manufacturers may run slightly high or low. For food costing purposes, always measure your specific disher against a liquid measuring cup before building a cost model around the stamped number.
Building a Scoop Number System That Actually Holds Up in Service
Understanding the numbering system is step one. The step most operators skip is turning that understanding into a station system that works under real service conditions — when it is busy, when staff are new, and when nobody has time to think about which scoop goes with which product.
The system we recommend:
Assign one disher number to every menu item. Document it. No ambiguity.
Map the number to its handle color. Post that reference at the station — not in a manual.
Verify actual yield against the formula for your specific disher set. Adjust your cost model accordingly.
Train level scoops at every pre-service. A heaped scoop is a different number at the same price.
Weigh ten scoops monthly during peak season. Catch yield drift before it shows up on the P&L.
The formula is 30 seconds to learn. The system is what protects the margin across an entire season. Build both — starting with the number on the disher, and ending with an audit cadence that makes the formula mean something for every service.
"The number on the scoop is the most important piece of kitchen math most operators never actually learn — and the most expensive piece they never apply. We've spent years watching kitchens where the chef could recite the formula perfectly and still had no standardized disher assignment, no color chart at the station, and no audit in the monthly routine, with the portioning system rarely supported by a recipe template. Knowing that 32 divided by the scoop number gives you fluid ounces doesn't protect your margin. What protects your margin is the laminated chart inside the reach-in door, the one assigned number per menu item that nobody questions during a rush, and the ten scoops weighed on the first of every month that tell you whether the system is still holding. The formula is thirty seconds. The system is the entire season. We've never met an operator who regretted building one — and we've met plenty who spent months diagnosing a food cost problem that was always a missing system."
Essential Resources
The Chart We Built Because We Kept Getting the Question Wrong
We've answered the scoop size question enough times to know the problem isn't the formula — it's having the full reference in front of you when you need it. This is ours: every disher from #4 through #100, with fluid ounce yields, tablespoon equivalents, and cup fractions. Print it. Tape it inside the reach-in door. Stop guessing during service. Resource: Disher Scoop Sizes Chart — Chef's Resources URL: https://www.chefs-resources.com/culinary-conversions-calculators-and-capacities/scoop-disher-sizes/
Read This Before You Order a Single Disher
We've seen operators buy a case of dishers and realize at the station that they ordered the wrong mechanism for the job. WebstaurantStore's buying guide covers disher types, handles color standards, material differences, and cleaning requirements before the order goes in. That's the right sequence. Resource: Ice Cream Scoop & Food Disher Buying Guide — WebstaurantStore URL: https://www.webstaurantstore.com/guide/717/kitchen-scoop-and-disher-guide.html
The Number the Federal Government Uses for Scoop Capacity
When you need an authoritative capacity figure for food costing, procurement, or a nutrition program audit, this is the document that settles the question. The USDA's Table 13 is the baseline used by institutional foodservice operations nationwide. Not an opinion. Not a manufacturer's spec sheet. The federal standard. Resource: USDA Food Buying Guide Table 13: Sizes and Capacities of Scoops (Dishers) URL: https://foodbuyingguide.fns.usda.gov/Content/TablesFBG/Table13_FBG_Sizes_and_Capacities_of_Scoop_s_(or_Dishers).pdf
Two Sentences That Explain the Entire Numbering System
Gygi gets it done fast: the number tells you how many scoops fill a quart, the larger the number the smaller the scoop, and here's what each size is actually used for. If someone on your team has never worked with standardized dishers before, start here. It's the fastest way from confused to operational. Resource: Food Disher Sizing — Gygi URL: https://gygi.com/blogs/create/food-disher-sizing
Why the Wrong Tool at the Wrong Station Costs You More Than You Think
A disher and an ice cream scoop are not the same tool. We've watched operators run a disher through hard-pack ice cream and burn through equipment in a single season because no one made the distinction at setup. Restaurantware's buying guide covers material differences, mechanism types, and use-case matching so you get the right tool at the right station before service starts. Resource: Portion Scoops Buying Guide — Restaurantware URL: https://www.restaurantware.com/blogs/smallwares/portion-scoops-buying-guide
Matching Scoop Size to Concept When Nobody Told You How at Opening
Most small shops pick a scoop size at opening and never revisit it. KimEcopak's size guide breaks down ounce yields from #8 through #40 and connects each to a service model and price point. If your scoop size was inherited from whoever set up the station before you, this is where you check whether it still makes sense. Resource: Ice Cream Scoop Size Guide — KimEcopak URL: https://www.kimecopak.ca/blogs/kitchen-tools/ice-cream-scoop-size-guide
Why the Same Scoop Number Doesn't Always Mean the Same Volume
Here's something we learned the hard way: a #16 from one manufacturer and a #16 from another don't always hold the same amount. Wikipedia's entry on the scoop as a utensil explains why — sizing standards are followed loosely across the industry, and manufacturer specs vary more than most operators realize. It also traces the tool back to Alfred L. Cralle's 1897 patent, which is worth knowing. Context matters when you're trying to cost accurately across product lines. Resource: Scoop (Utensil) — Wikipedia URL: https://en.wikipedia.org/wiki/Scoop_(utensil)
These essential resources give operators the reference data, equipment guidance, and cost-control methodology needed to turn scoop size into a consistent operational system. When that information is organized inside a recipe template, portion yields, disher assignments, and cost calculations stay aligned across every shift, helping kitchens maintain predictable margins and accurate portion control.
Supporting Statistics
The industry you're operating in is too large for a guessed portion size.
We've said for years that the scoop size decision feels small until you do the math at scale. Here's the scale:
U.S. ice cream makers produced 1.31 billion gallons in 2024
The industry generates an $11.6 billion economic impact
26,704 direct jobs. $1.9 billion in direct wages
Premium and regular ice cream accounts for 80% of the market
The majority of marketing happens at the local and regional level
That last point is the one that matters most. The competitive pressure doesn't land on national brands. It lands on the shop with six tables and one reach-in. At that scale, the scoop number isn't a smallwares decision. It's a business decision made hundreds of times a day. Source: IDFA — Ice Cream Sales & Trends https://www.idfa.org/ice-cream-sales-trends
When we look at what a half-ounce drift costs inside actual industry margins, the number isn't abstract.
The National Restaurant Association's 2025 Restaurant Operations Data Abstract — built from more than 900 operators — tells the story clearly:
Median food and beverage cost: 32.4% of sales for limited-service operators in 2024
Above $2M in annual sales: 31.0% food cost / 4.3% pre-tax income
Below $2M in annual sales: 33.7% food cost / 1.1% pre-tax income
Food and labor costs have each risen 35% since 2019
Average pre-tax margin across the industry: 3 to 5%
Most independent ice cream shops operate below that $2 million threshold. A half-ounce of drift on a #16 scoop pushed 200 times a day isn't a rounding error inside those numbers. It's the margin. Sources: National Restaurant Association — Restaurant Operators Kept Food Cost Ratios in Check in 2024 / Higher Volume Restaurants Reported Lower Food-Cost Ratios in 2024 / Inflation https://restaurant.org/research-and-media/research/restaurant-economic-insights/analysis-commentary/restaurant-operators-kept-food-cost-ratios-in-check-in-2024/ https://restaurant.org/research-and-media/research/restaurant-economic-insights/analysis-commentary/higher-volume-restaurants-reported-lower-food-cost-ratios-in-2024/ https://restaurant.org/research-and-media/research/inflation/
The portion decision isn't just a cost problem. We've watched it become a waste problem operators don't see coming.
ReFED's 2024 foodservice data puts the scope of the problem in plain numbers:
12.5 million tons of surplus food generated by U.S. restaurants and foodservice operations
$157 billion in total surplus value — equivalent to 14% of all foodservice sales
85%+ of that surplus went to landfill or incineration
70% of foodservice food waste is plate waste — food served that guests couldn't finish
The largest driver isn't spoilage. It isn't over-purchasing. It's portion size. We've seen this play out at the scoop station: an operator running a #8 because that's what came with the equipment, serving a portion a significant share of guests leave in the cup, and diagnosing the problem as a sales issue when it was always a portion issue. ReFED identifies right-sizing portions as one of the most direct operational levers available to foodservice operators. It's also the one that costs less than $20 to implement. Source: ReFED — Restaurants and Foodservice / Food Waste by Sector: Foodservice Fact Sheet (2024 data) https://refed.org/stakeholders/restaurants-and-foodservice/ https://refed.org/downloads/by-sector-foodservice-2025.pdf
These supporting statistics reinforce a simple operational truth: portion control decisions shape cost, waste, and long-term profitability in foodservice. Establishing a consistent portioning system turns scoop size into a controllable business variable, creating the same kind of operational discipline seen in self-sustаіnіng farming, where measured inputs, efficient resource use, and repeatable processes determine whether an operation remains financially sustainable over time.
Final Thoughts
The scoop numbering system isn't the problem. It's one of the simplest tools in any commercial kitchen. Divide 32 by the number on the handle. That's your fluid ounce yield. A first-year culinary student can learn it in thirty seconds.
The problem is the gap between knowing the formula and building something around it.
We've walked into operations where the chef could recite the formula without hesitation — and still couldn't answer three basic questions:
Why was this scoop size chosen over a #12 or a #20?
When was that choice made?
Has anyone weighed a scoop in the last six months?
The formula was understood. The system didn't exist. And a slow margin bleed had been misdiagnosed for two seasons running.
What the tightest operators do differently isn't complicated:
Make one deliberate decision about which scoop number to use
Assign one disher per menu item — no exceptions during service
Post a laminated chart inside the reach-in door
Weigh ten scoops on the first of every month
Adjust before drift has a chance to compound
That's the entire system. It costs nothing to build and pays back in the first week of service.
The part that rarely gets said directly: scoop size is one of the few decisions that touches food cost, waste, customer perception, and staff consistency all at once.
Oversized portions look like customer satisfaction — until they show up as margin erosion
Undersized portions look like cost control — until they show up as complaints about a stingy scoop
The number on the handle is the lever that moves all of it
We've never met an operator who regretted standardizing their scoop size. We've met plenty who wish they'd done it at opening instead of eighteen months in.
FAQ on Ice Cream Scoop Size
Q: What do the numbers on ice cream scoops mean? A: The number is a portioning formula. Divide 32 by the scoop number to get the fluid ounce yield per portion. Higher number, smaller scoop. Every time, no exceptions.
#8 = 4 oz
#10 = 3.2 oz
#12 = 2.67 oz
#16 = 2 oz
#20 = 1.6 oz
#24 = 1.33 oz
We've seen this single piece of kitchen math close food cost variances that operators had been misdiagnosing for months.
Q: What size scoop do most ice cream shops use? A: The commercial default is a #16 disher at 2 fluid ounces. Where operators move from there is predictable:
High-volume shops drop to a #20 to protect margin at scale
Premium and artisan shops move to a #12 or #10 to support a higher price point
The number matters less than whether the choice was made deliberately — not inherited from whoever stocked the station at opening.
Q: How many ounces is a standard ice cream scoop? A: The commercial standard is 2 ounces from a #16 disher. The working range across most operations:
Smaller end: 2 oz (#16)
Larger end: 4 oz (#8)
What costs operators the most isn't choosing the wrong size. It's never a choice at all. Most shops are running whatever comes with the equipment. The ounce yield was never chosen. It was defaulted into.
Q: What is the difference between a disher and an ice cream scoop? A: Two different tools built for two different jobs:
Disher: Spring-loaded portion control tool. Built for soft foods. Delivers consistent measurable yield per activation.
Ice cream scoop: Built for frozen desserts. More leverage, sturdier bowl, designed to release hard-pack product cleanly without tool or hand fatigue.
Running a disher through hard-pack ice cream destroys the equipment. We've seen it happen in a single season. Match the tool to the application before stocking the station. It's a $30 decision that prevents a recurring replacement cost.
Q: How do I know if my scoop size is costing me money? A: Run this three-step audit. The answer is almost always hiding in step three.
Calculate cost per fluid ounce from your most recent product invoice
Multiply by the stated fluid ounce yield for your current disher number
Weigh ten actual scoops from your station — divide by ten — compare against the stated yield
If the real number is higher than the stated number, you've found the problem. That gap between stated yield and actual yield — pushed across 150 to 200 portions a day — is where most ice cream shop food cost variance lives, and where it compounds the longest before anyone thinks to look.


